
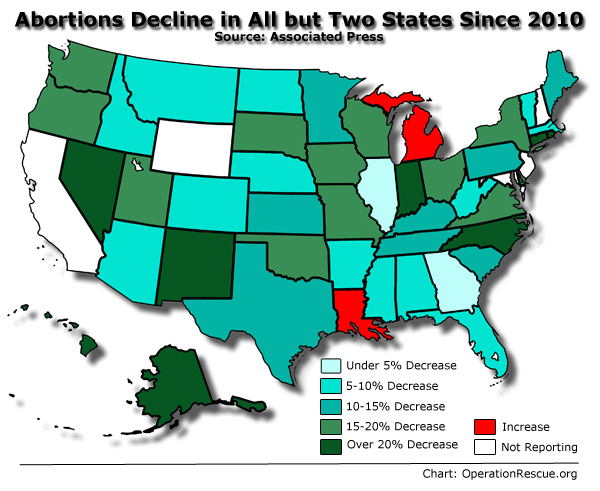
A new national report from the Associated Press indicates that abortions have dropped 12 percent nationwide and are down in almost every state in the country as more babies are being saved from abortions than ever before.
The survey found abortions are dropping the most in states that have passed the most pro-life laws, but abortions are down even in pro-abortion states that haven’t passed as many pro-life laws. Those figures make it clear that national pro-life educational efforts, pregnancy support services and pro-life prayer and educational campaigns at abortion clinics nationwide are making a difference in providing women with abortion alternatives.
North Carolina had the second largest decrease in abortions at 26.3 percent followed by New Mexico with a 23.9 percent drop.
Abortions have declined in states where new laws make it harder to have them — but they’ve also waned in states where abortion rights are protected, an Associated Press survey finds. Nearly everywhere, in red states and blue, abortions are down since 2010.
Several of the states that have been most aggressive in passing anti-abortion laws — including Indiana, Missouri, Ohio, and Oklahoma — have seen their abortion numbers drop by more than 15 percent since 2010. But more liberal states such as New York, Washington and Oregon also had declines of that magnitude, even as they maintained unrestricted access to abortion.
The AP obtained the most recent abortion numbers from the health departments of all 45 states that compile such data on a comprehensive basis. (States not compiling such data are California, Maryland, New Jersey, New Hampshire and Wyoming.) With one exception, the data was from either 2013 or 2014 — providing a unique nationwide gauge of abortion trends during a wave of anti-abortion laws that gathered strength starting in 2011.
The pro-life movement has been increasingly focused in recent years on closing down abortion clinics — especially those that fail t comply with basic health and safety laws to protect women that legitimate medical centers routinely follow. The high number of abortion clinics closed in recent years is party to credit for the reduction in abortions, the AP survey indicates.
While some of the new laws have been blocked by lawsuits, most have taken effect, contributing to closure of about 70 abortion clinics in a dozen states since 2010. States with the most closures, according to state officials and advocacy groups, include Texas with 27, Michigan and Arizona with about 12, and Ohio with at least four. Two clinics closed in Virginia, including one that was the state’s busiest.
“The states where we see large decreases in abortion numbers are generally states that experienced abortion clinic closures and in states with very active pro-life opposition,” said Troy Newman, President of Operation Rescue and co-author of the book Abortion Free. “Of course other factors contributed to the decrease, but these numbers confirm that when abortion clinics close, abortion numbers drop and lives are saved.”
“The Associated Press report is great news. It proves that Americans are rejecting abortions in favor of life in unprecedented numbers,” said Newman. “There’s no doubt that we are winning and the abortion cartel is waning.”
Click here to sign up for daily pro-life news alerts from LifeNews.com
“The numbers show that even in political climates where abortion is unrestricted, large pro-life gains can still be made,” said Newman. “This validates the hard work of pro-life groups and supporters who have labored tirelessly for decades in a number of venues to turn the rudder of the ship way from the abortion cartel and toward a culture of life.”
Abortion Decreases By State Since 2010
(Source: Associated Press)
___
Alabama
2010: 9,029
2013: 7,423
Change: Down 17.8 percent
___
Alaska:
2010: 1,715
2014: 1,361
Change: Down 20.6 percent
___
Arizona
2011: 13,606
2014: 12,900
Change: Down 5.2 percent
(Arizona changed its abortion-reporting system in 2011)
___
Arkansas:
2010: 4,532
2014: 4,273
Change: Down 5.7 percent
___
California:
No data available. State does not mandate reporting by abortion providers.
___
Colorado:
2010: 11,210
2013: 10,199
Change: Down 9 percent
___
Connecticut:
2010: 13,438
2014: 10,629
Change: Down 20.9 percent.
___
Delaware:
2010: 4,666
2012: 3,823
Change: Down 18.1 percent
___
Florida:
2010: 79,908
2014: 72,107
Change: Down 9.8 percent
___
Georgia:
2010: 31,315
2013: 30,378
Change: Down 3 percent
___
Hawaii:
2010: 3,064
2014: 2,147
Change: Down 29.9 percent
___
Idaho:
2010: 1,510
2013: 1,375
Change: Down 8.9 percent
___
Illinois: (surgical abortions only)
2010: 41,859
2013: 40,750
Change: Down 2.6 percent
___
Indiana:
2010: 10,031
2013: 8,027
Change: Down 20 percent
___
Iowa:
2010: 5,399
2013: 4,423
Change: Down 18.1 percent
___
Kansas:
2010: 8,373
2014: 7,263
Change: Down 13.3 percent
___
Kentucky:
2010: 3,929
2014: 3,442
Change: Down 12.4 percent
___
Louisiana:
2010: 8,872
2014: 9,932
Change: Up 11.9 percent
___
Maine:
2010: 2,311
2014: 2,020
Change: Down 12.6 percent
___
Maryland:
No data available. State does not mandate reporting by abortion providers.
___
Massachusetts:
2010: 20,802
2013: 19,448
Change: Down 6.5 percent
___
Michigan:
2010: 23,307
2014: 27,629
Change: Up 18.5 percent
___
Minnesota:
2010: 11,505
2013: 9,903
Change: Down 13.9 percent
___
Mississippi
2010: 2,297
2013: 2,170
Change: Down 5.5 percent
___
Missouri:
2010 – 6,163
2014: 5,060
Change: Down 17.9 percent
___
Montana:
2010: 2,160
2013: 1,842
Change: Down 14.7 percent
___
Nebraska:
2010: 2,464
2014: 2,270
Change: Down 7.9 percent
___
Nevada:
2010: 7,787
2013: 6,056
Change: Down 22.1 percent
___
New Hampshire:
No data available. State does not mandate reporting by abortion providers.
___
New Jersey:
No comprehensive data available. Health Department does not track number of abortions.
___
New Mexico:
2010:4,478
2013: 3,408
Change: Down 23.9 percent
___
New York:
2010: 111,212
2013: 94,326
Change: Down 15.2 percent
___
North Carolina:
2010: 30,952
2013: 22,820
Change: Down 26.3 percent
___
North Dakota:
2010: 1,291
2013: 1,182
Change: Down 8.4 percent
___
Ohio:
2010: 28,123
2013: 23,216
Change: Down 17.4 percent
___
Oklahoma:
2010: 5,641
2013: 4,587
Change: Down 18.7 percent
___
Oregon:
2010: 9,990
2014: 8,198
Change: Down 17.9 percent
___
Pennsylvania:
2010: 36,788
2013: 32,108
Change: Down 12.7 percent
___
Rhode Island:
2010: 4,181
2013: 3,251
Change: Down 22.2 percent
___
South Carolina:
2010: 6,464
2014: 5,708
Change: Down 11.7 percent
___
South Dakota:
2010: 737
2013: 601
Change: Down 18.5 percent
___
Tennessee:
2010: 16,373
2013: 14,216
Change: Down 13.3 percent
___
Texas:
2010: 72,592
2013: 63,849
Change: Down 12 percent
___
Utah:
2010: 3,446
2013: 2,893
Change: Down 16 percent
___
Vermont:
2010: 1,333
2013: 1,217
Change: Down 8.7 percent
___
Virginia:
2010: 25,940
2013: 20,852
Change: Down 19.6 percent
___
Washington:
2010: 21,124
2013: 17,592
Change: Down 16.7 percent
___
West Virginia:
2010: 1,999
2013: 1,876
Change: Down 6.2 percent
___
Wisconsin:
2010: 7,825
2013: 6,462
Change: Down 17.4 percent
___
Wyoming:
No comprehensive data available. Health department says number of abortions too low to meet threshold for vital statistics reporting.